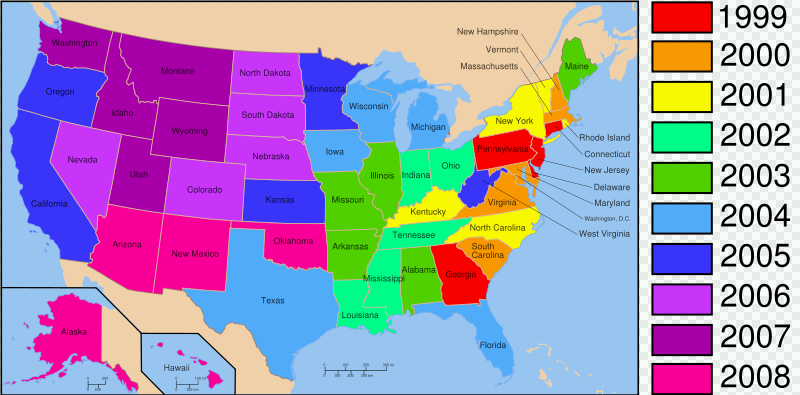
(Image taken from wikipedia: http://en.wikipedia.org/wiki/Image:State_Quarters_Year_Map.svg )
Started in 1999, the US 50 State Quarters Program® commemorates its 50 states over 10 years, releasing 5 different designs each year. 2008 will be the last year that the US mint will strike the last state quarters and 2009 for territorial quarters. Although these coins are struck in terms of hundreds of millions by Denver and Philadelphia, finding them may be another challenge.
More details are available on the US mint site. Mintage figures are from here: http://www.usmint.gov/about_the_mint/coin_production/?action=production_figures
Special thanks to Art and slowly but surely on coinpeople.com!
| State | Denver | Philadelphia |
| Delaware
D: 401,420,000 P: 373,400,000
|
 |
|
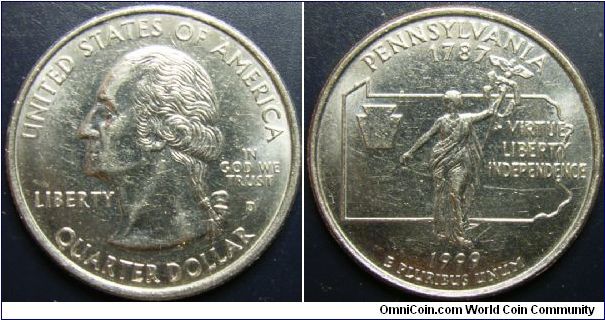
| Pennsylvania D: 378,332,00 P: 349,000,000
|
 |
|
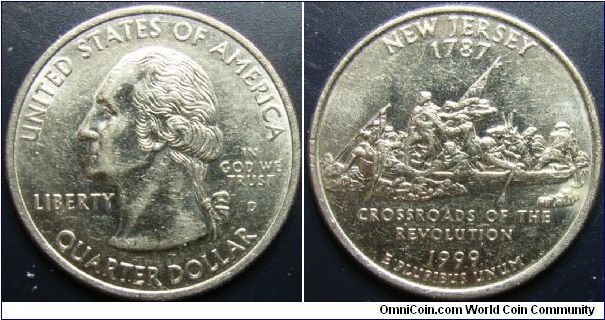
| New Jersey D: 299,028,000 P: 363,200,000
|
 |
|
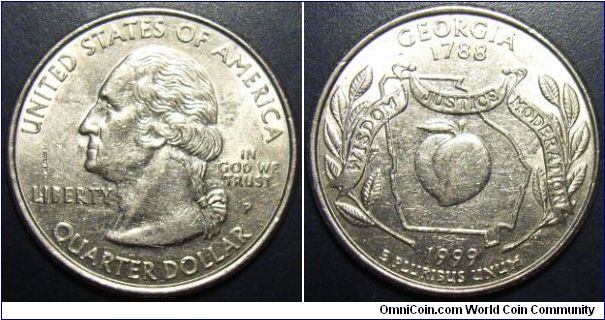
| Georgia D: 488,744,400 P: 451,188,000
|
 |
 |
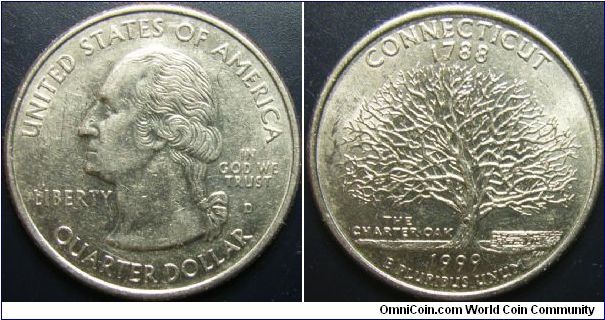
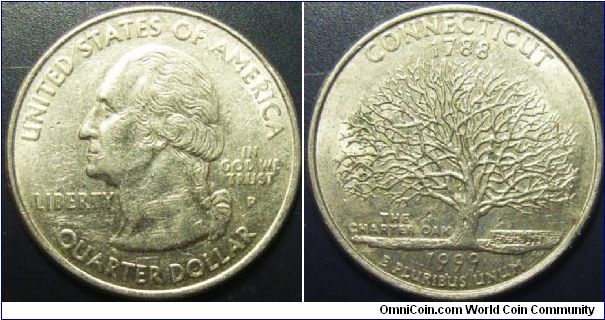
| Connecticut D: 657,880,000 P: 688,744,000
|
 |
 |
| State | Denver | Philadelphia |
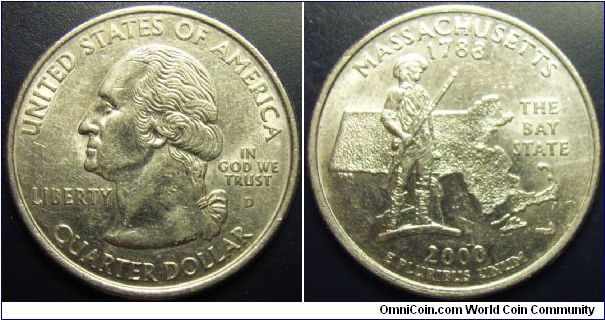
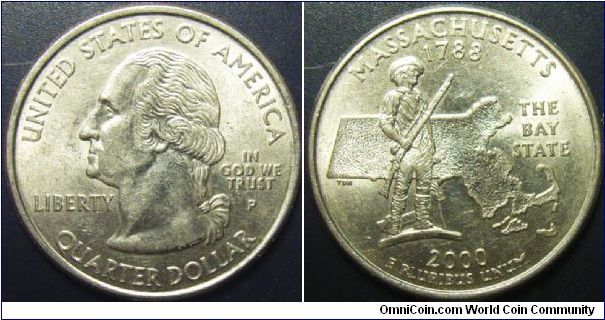
| Massachusetts D: 535,184,000 D: 628,600,000
|
 |
 |
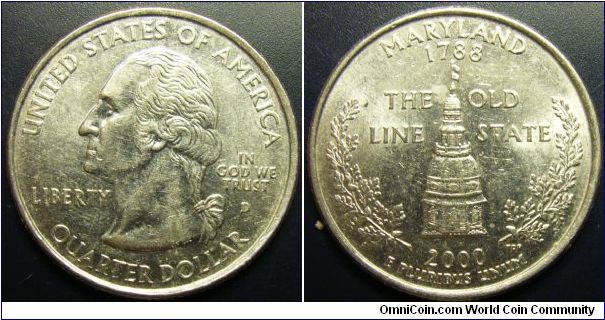
| Maryland D: 556,532,000 P: 678,200,000 |
 |
|
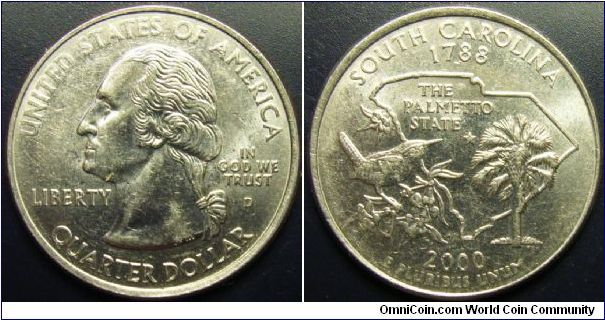
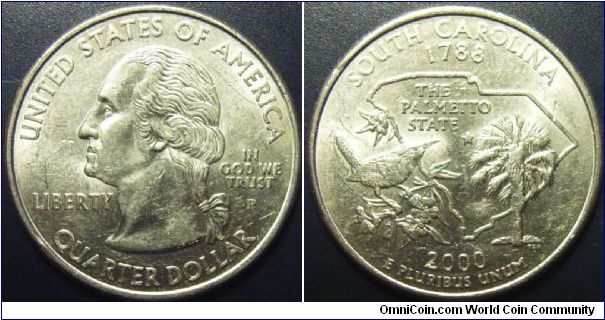
| South Carolina D: 566,208,000 P: 742,576,000 |
 |
 |
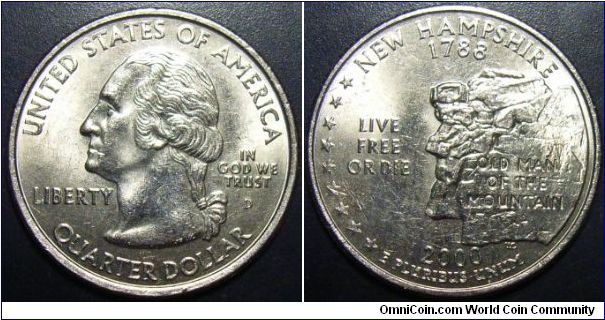
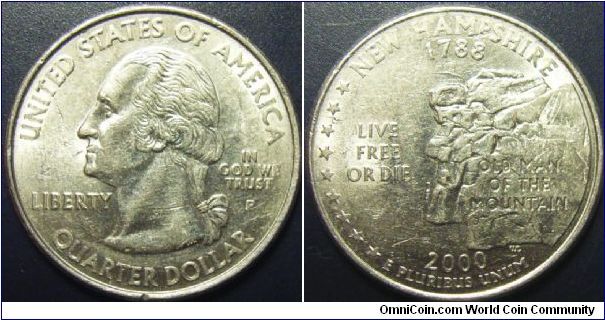
| New Hampshire D: 495,976,000 P: 673,040,000 |
 |
 |
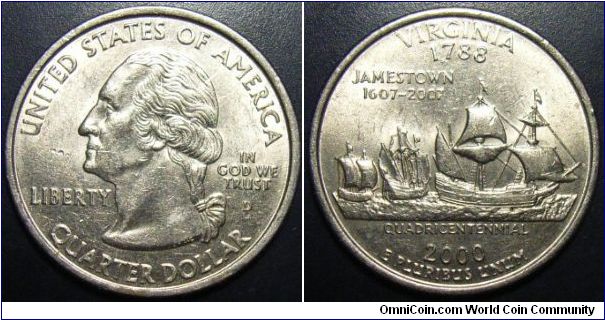
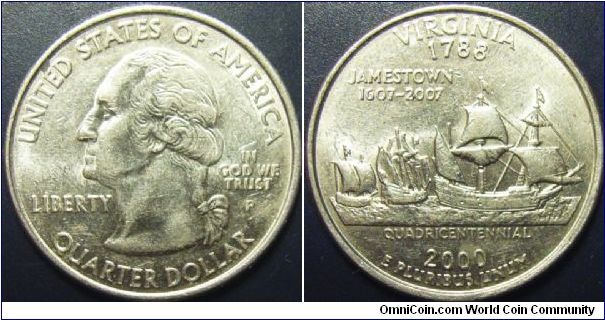
| Virginia D: 651,616,000 P: 943,000,000 |
 |
 |
| State | Denver | Philadelphia |
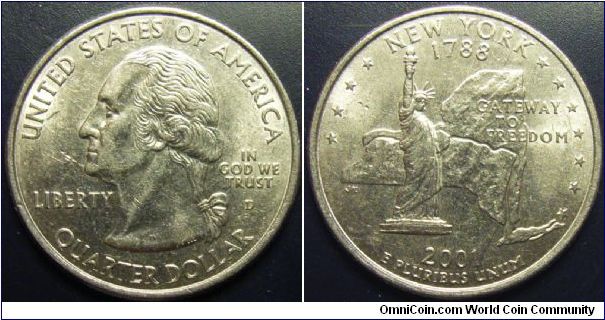
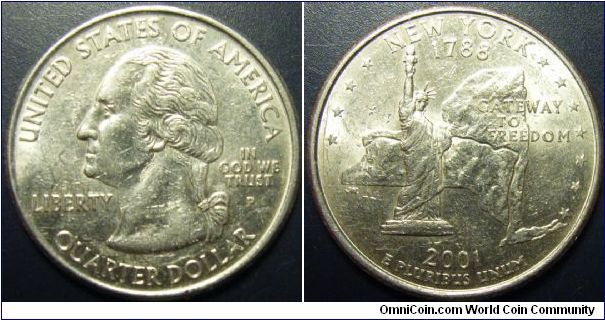
| New York D: 619,640,000 P: 655,400,000
|
 |
 |
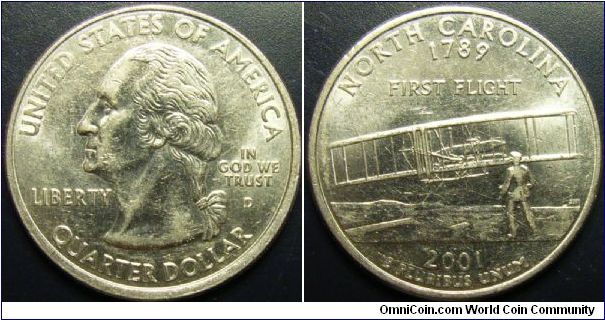
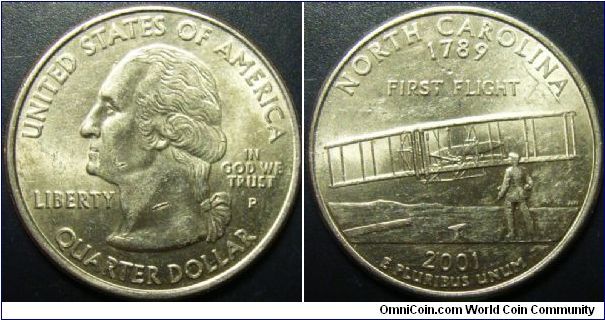
| North Carolina D: 427,876,000 P: 627,600,000 |
 |
 |
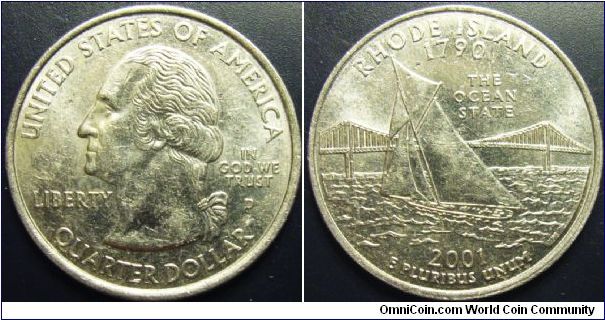
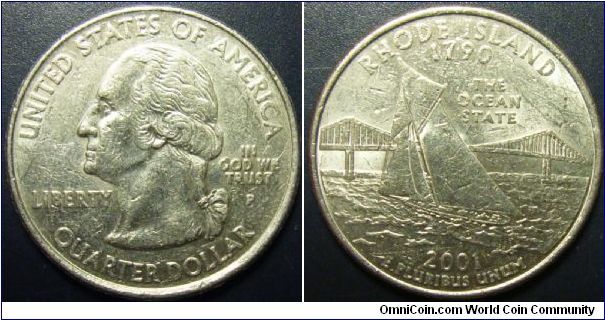
| Rhode Island D: 447,100,000 P: 423,000,000 |
 |
 |
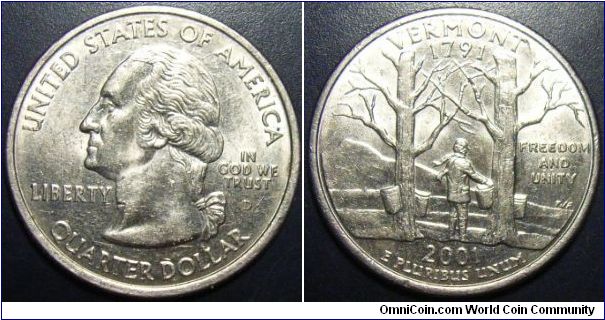
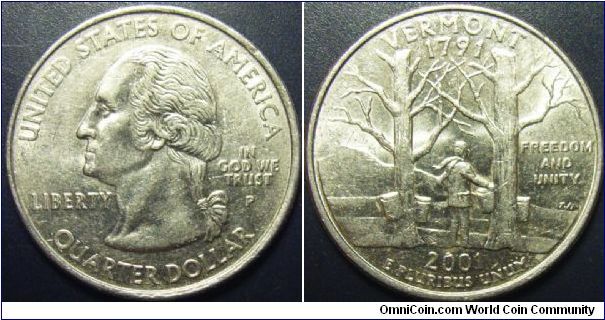
| Vermont D: 459,404,000 P: 423,500,000 |
 |
 |
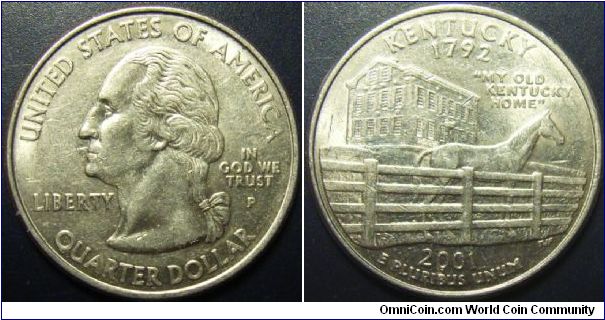
| Kentucky D: 370,564,000 P: 353,000,000 |
 |
 |
| State | Denver | Philadelphia |
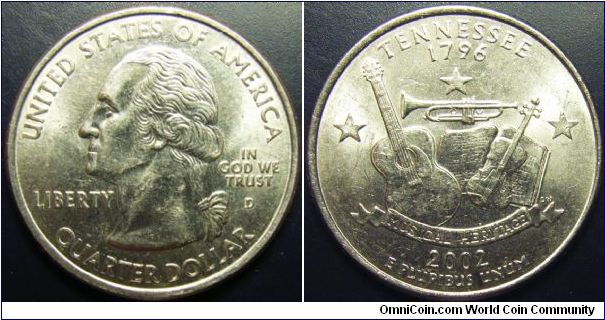
| Tennessee D: 286,486,000 P: 361,000,000
|
 |
|
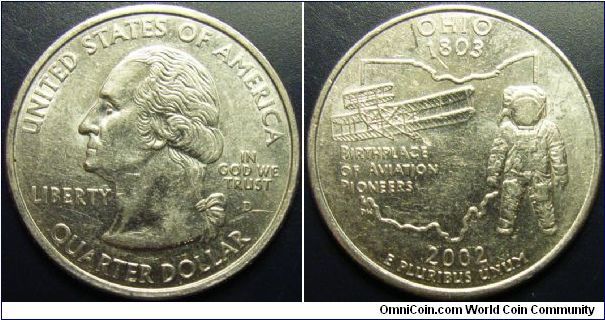
| Ohio D: 414,832,000 P: 217,200,000 |
 |
|
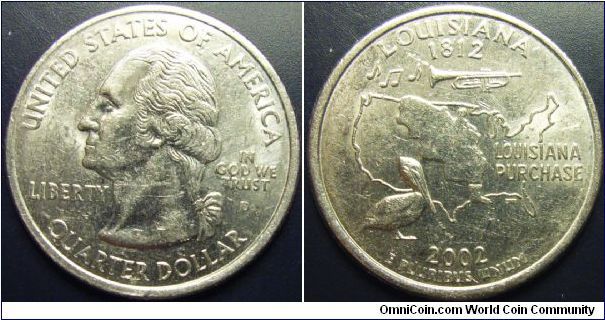
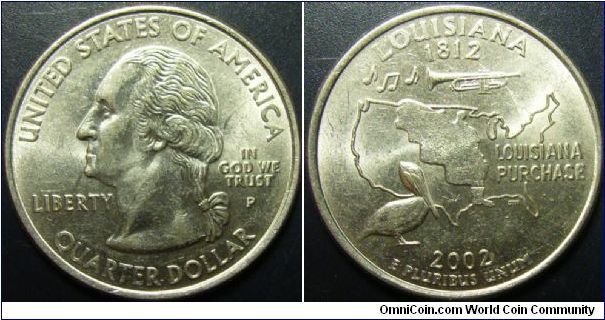
| Louisiana D: 402,204,000 P: 362,000,000 |
 |
 |
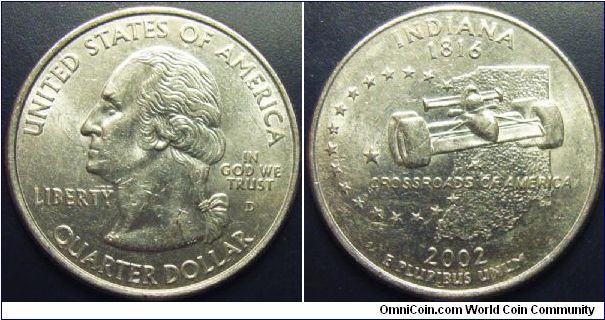
| Indiana D: 327,200,000 P: 362,000,000 |
 |
 |
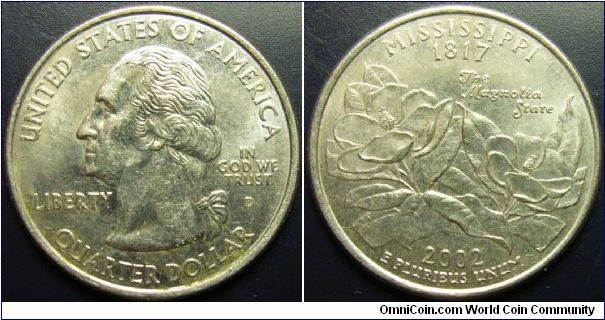
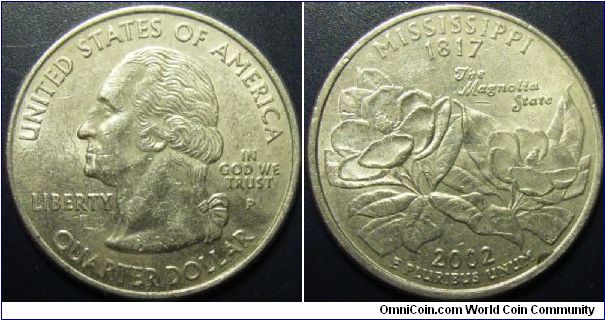
| Mississippi D: 289,600,000 P: 290,000,000 |
 |
 |
| State | Denver | Philadelphia |
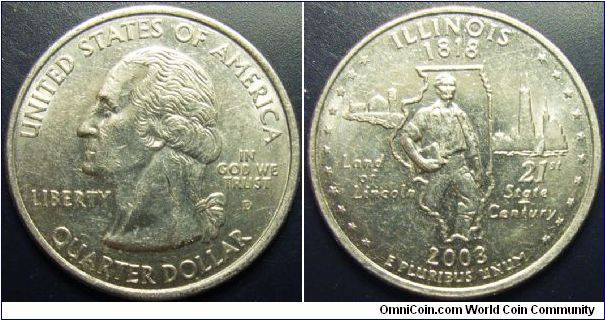
| Illinois D: 237,400,000 P: 225,800,000
|
 |
|
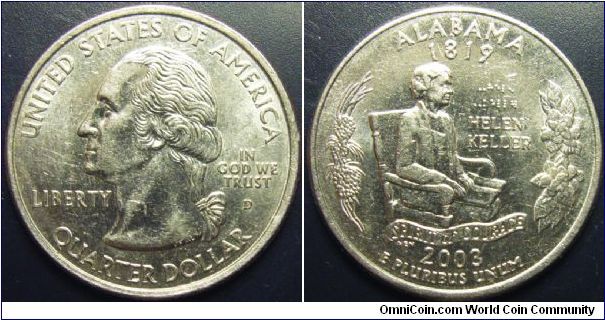
| Alabama D: 232,400,000 P: 225,000,000 |
 |
|
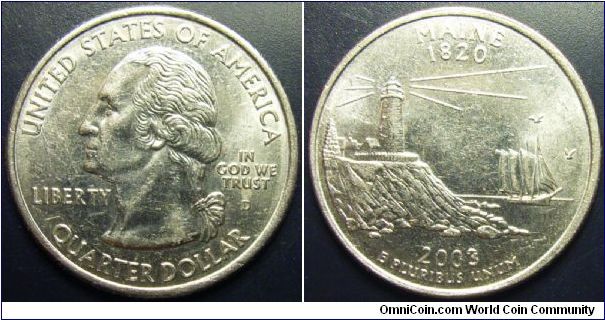
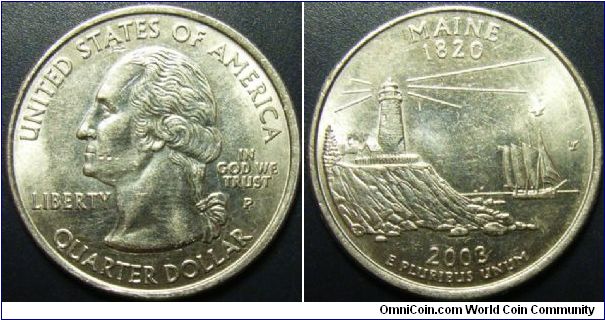
| Maine D: 231,400,000 P: 217,400,000 |
 |
 |
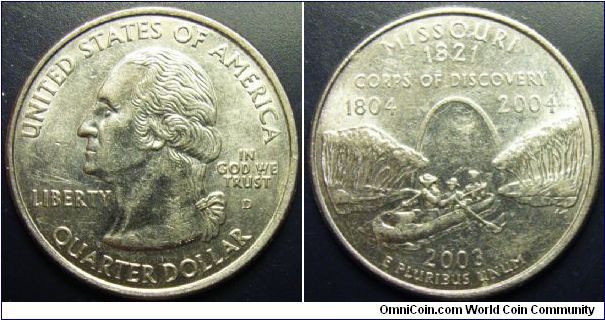
| Missouri D: 228,200,000 P: 225,000,000 |
 |
|
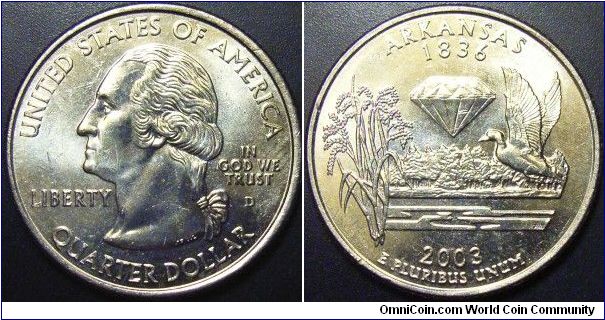
| Arkansas D: 229,800,000 P: 228,000,000 |
 |
| State | Denver | Philadelphia |
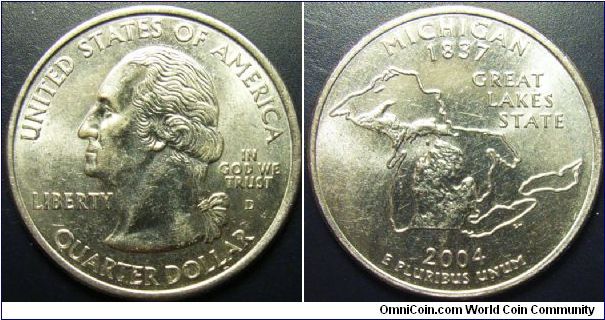
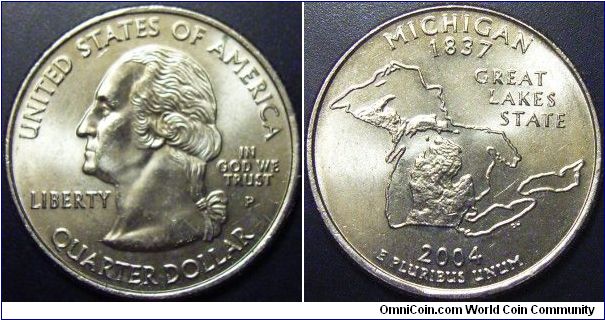
| Michigan D: 225,800,000 P: 233,800,000
|
 |
 |
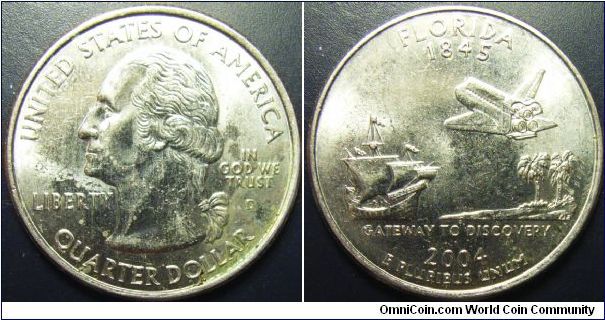
| Florida D: 241,600,000 P: 240,200,000 |
 |
|
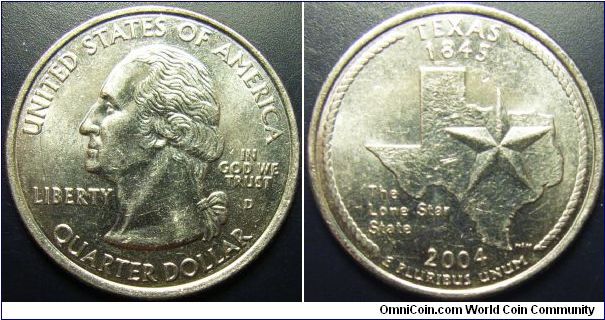
| Texas D: 263,000,000 P: 278,800,000 |
 |
 |
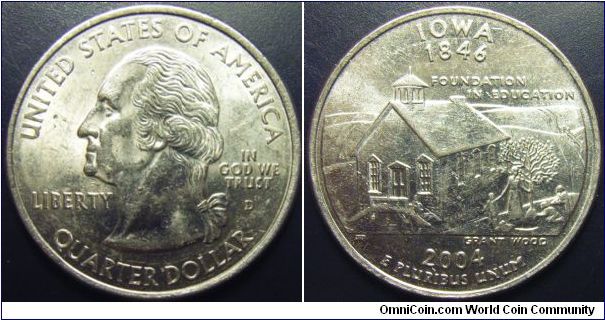
| Iowa D: 251,400,000 P: 213,800,000 |
 |
|
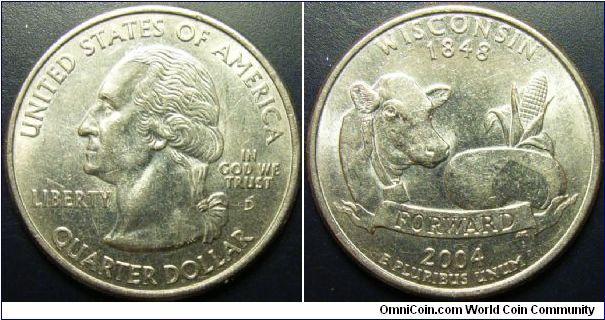
| Wisconsin D: 226,800,000 P: 226,400,000 |
 |
| State | Denver | Philadelphia |
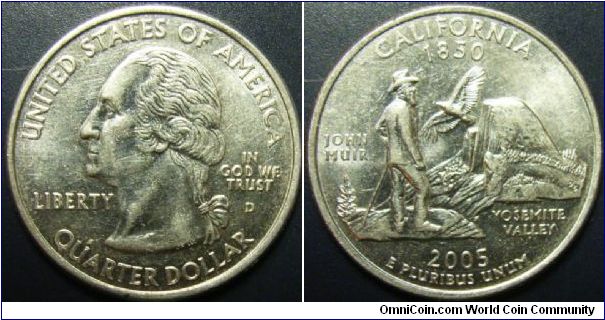
| California D: 263,200,000 P: 257,200,000
|
 |
 |
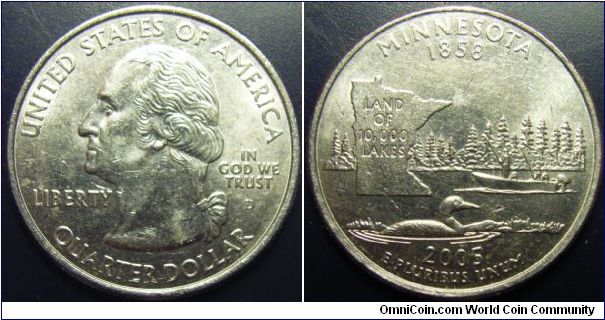
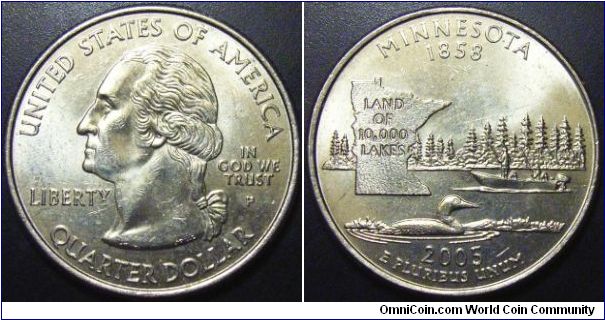
| Minnesota D: 248,400,000 P: 239,600,000 |
 |
 |
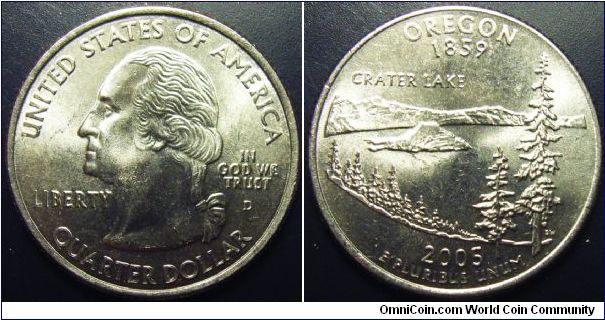
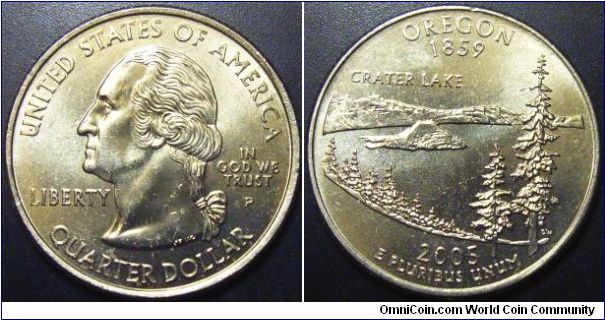
| Oregon D: 404,000,000 P: 316,200,000 |
 |
 |
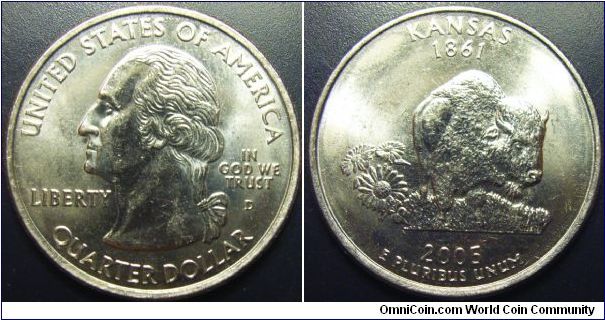
| Kansas D: 300,000,000 P: 263,400,000 |
 |
 |
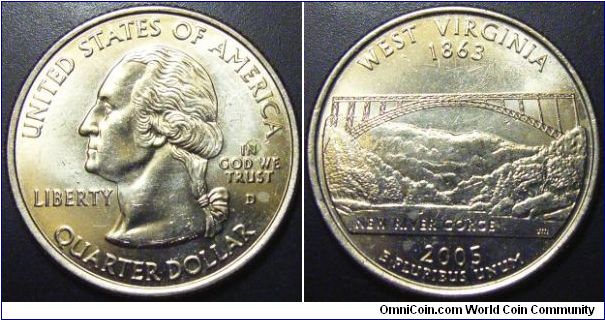
| West Virginia D: 356,200,000 P: 365,400,000 |
 |
| State | Denver | Philadelphia |
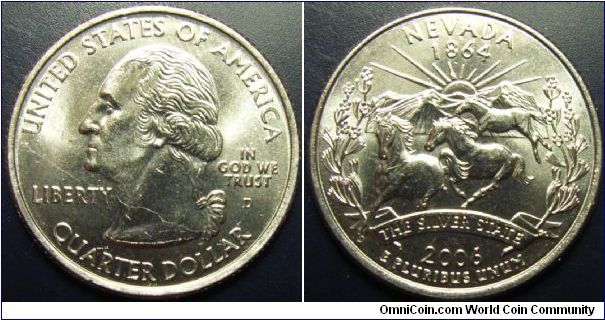
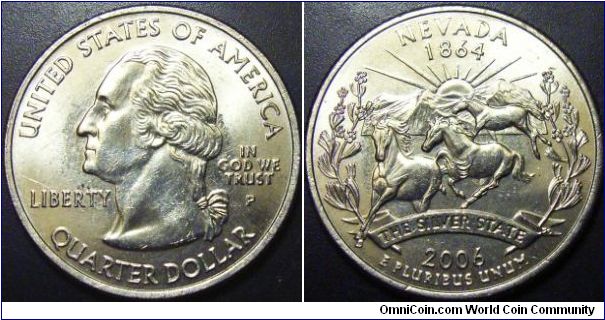
| Nevada D: 312,800,000 P: 277,000,000
|
 |
 |
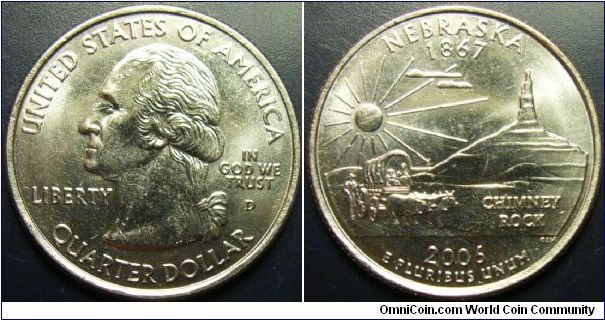
| Nebraska D: 276,400,000 P: 318,000,000 |
 |
|
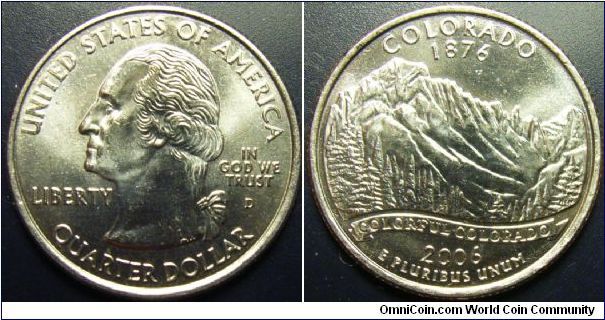
| Colorado D: 294,000,000 P: 274,800,000 |
 |
 |
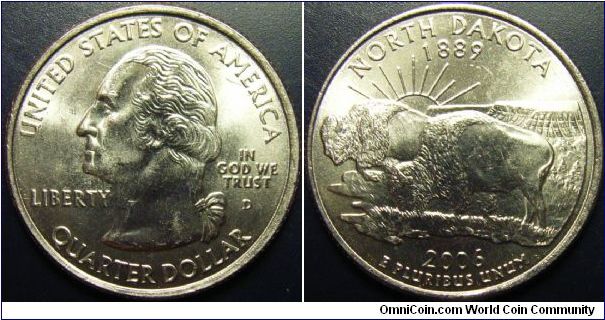
| North Dakota D: 359,000,000 P: 305,800,000 |
 |
|
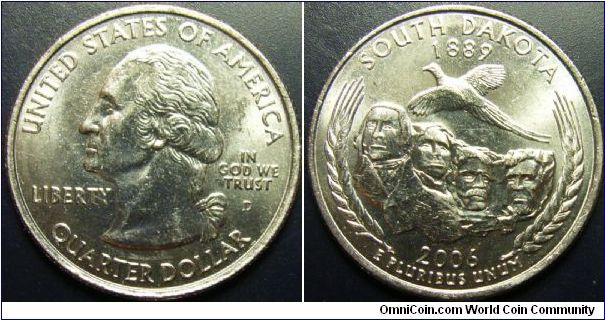
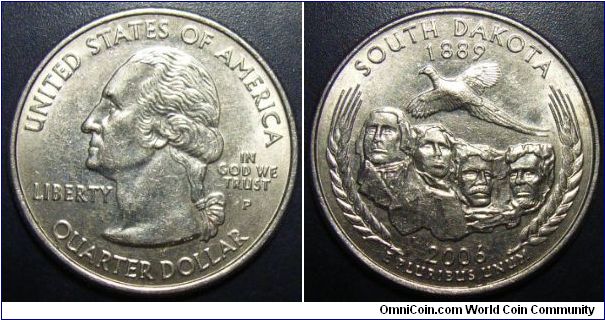
| South Dakota D: 265,800,000 P: 245,000,000 |
 |
 |
| State | Denver | Philadelphia |
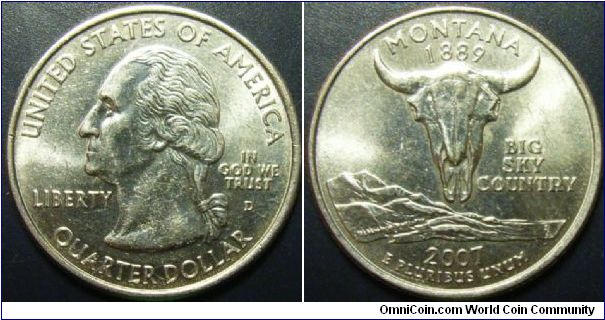
| Montana D: 256,240,000 P: 257,000,000
|
 |
 |
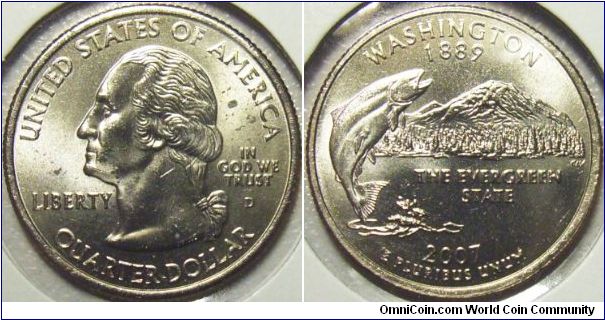
| Washington D: 280,000,000 P: 265,200,000 |
 |
|
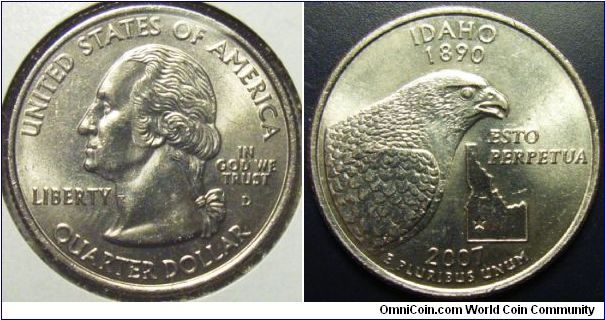
| Idaho D: 286,800,000 P: 294,600,000 |
 |
|
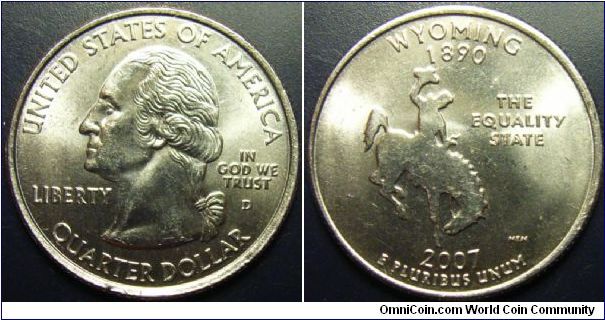
| Wyoming D: 320,800,000 P: 243,600,000 |
 |
|
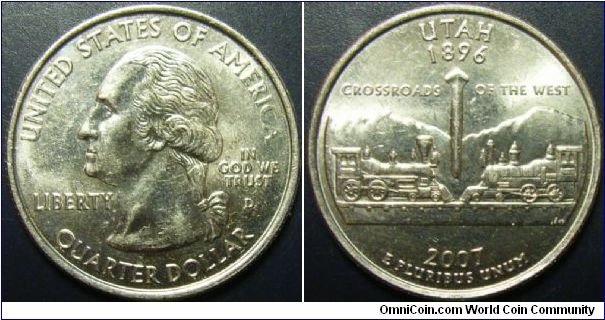
| Utah D: 253,200,000 P: 255,000,000 |
 |
| State | Denver | Philadelphia |
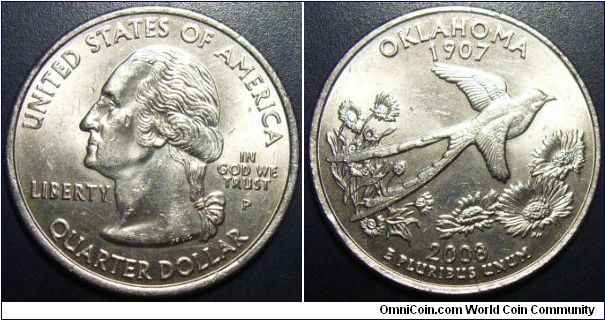
| Oklahoma D: 194,600,000 P: 222,000,000
|
 |
|
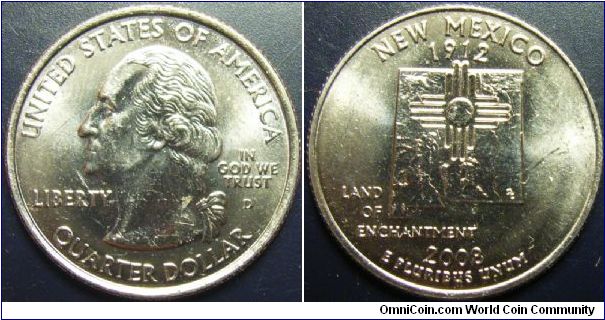
| New Mexico |
 |
|
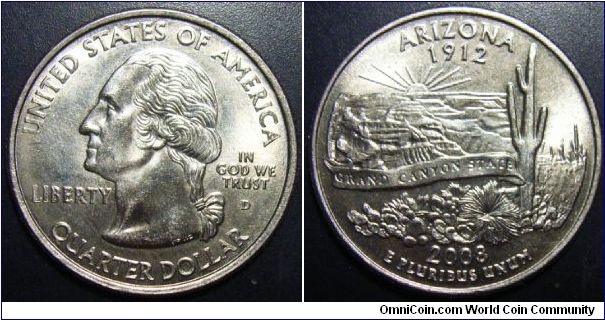
| Arizona |
 |
|
| Alaska | ||
| Hawaii |
27/02/2009